Here is how to find and read wildfire smoke forecast models for Seattle and the U.S.
 Scott Sistek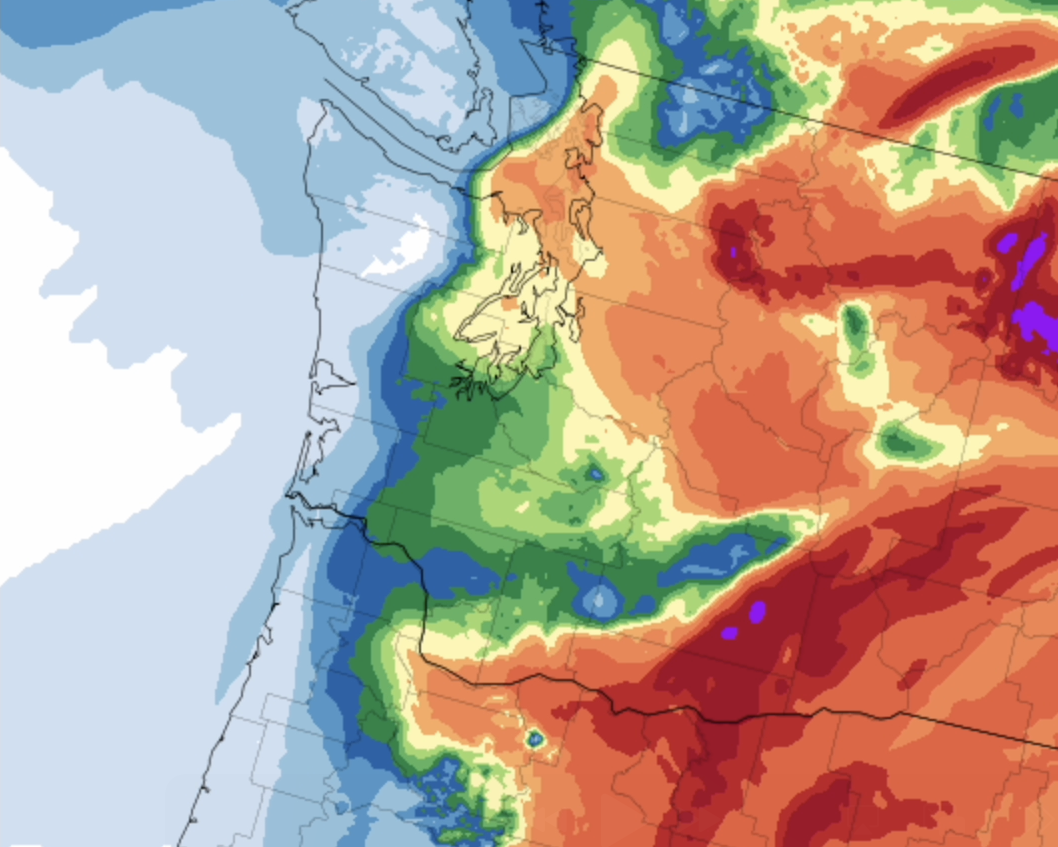
NOAA's HRRR-Smoke model forecast output
With large wildfires burning across swaths of Canada, the U.S. Upper Midwest and back into the U.S. West, dealing with wildfire smoke and its unhealthy air quality is becoming a frequent occurrence this summer.
Already, parts of the Great Lakes, Northeast and mid-Atlantic states have dealt with days of thick smoke, sometimes even reaching hazardous levels of particulates. Lately, parts of the Pacific Northwest have also had wildfire and smoke issues.
In recent years, NOAA developed a high-resolution forecast model (HRRR-Smoke) designed to predict where smoke plumes will drift, how dense they’ll get, and — most importantly — whether the smoke will stay high in the atmosphere or descend near the ground where we breathe it.
The site is a little clunky for non-meteorologists, but with a few tips, you can have this handy tool on your browser when you’re eager to see if smoke may be a factor in your area.
The main site is here: https://rapidrefresh.noaa.gov/hrrr/HRRRsmoke/
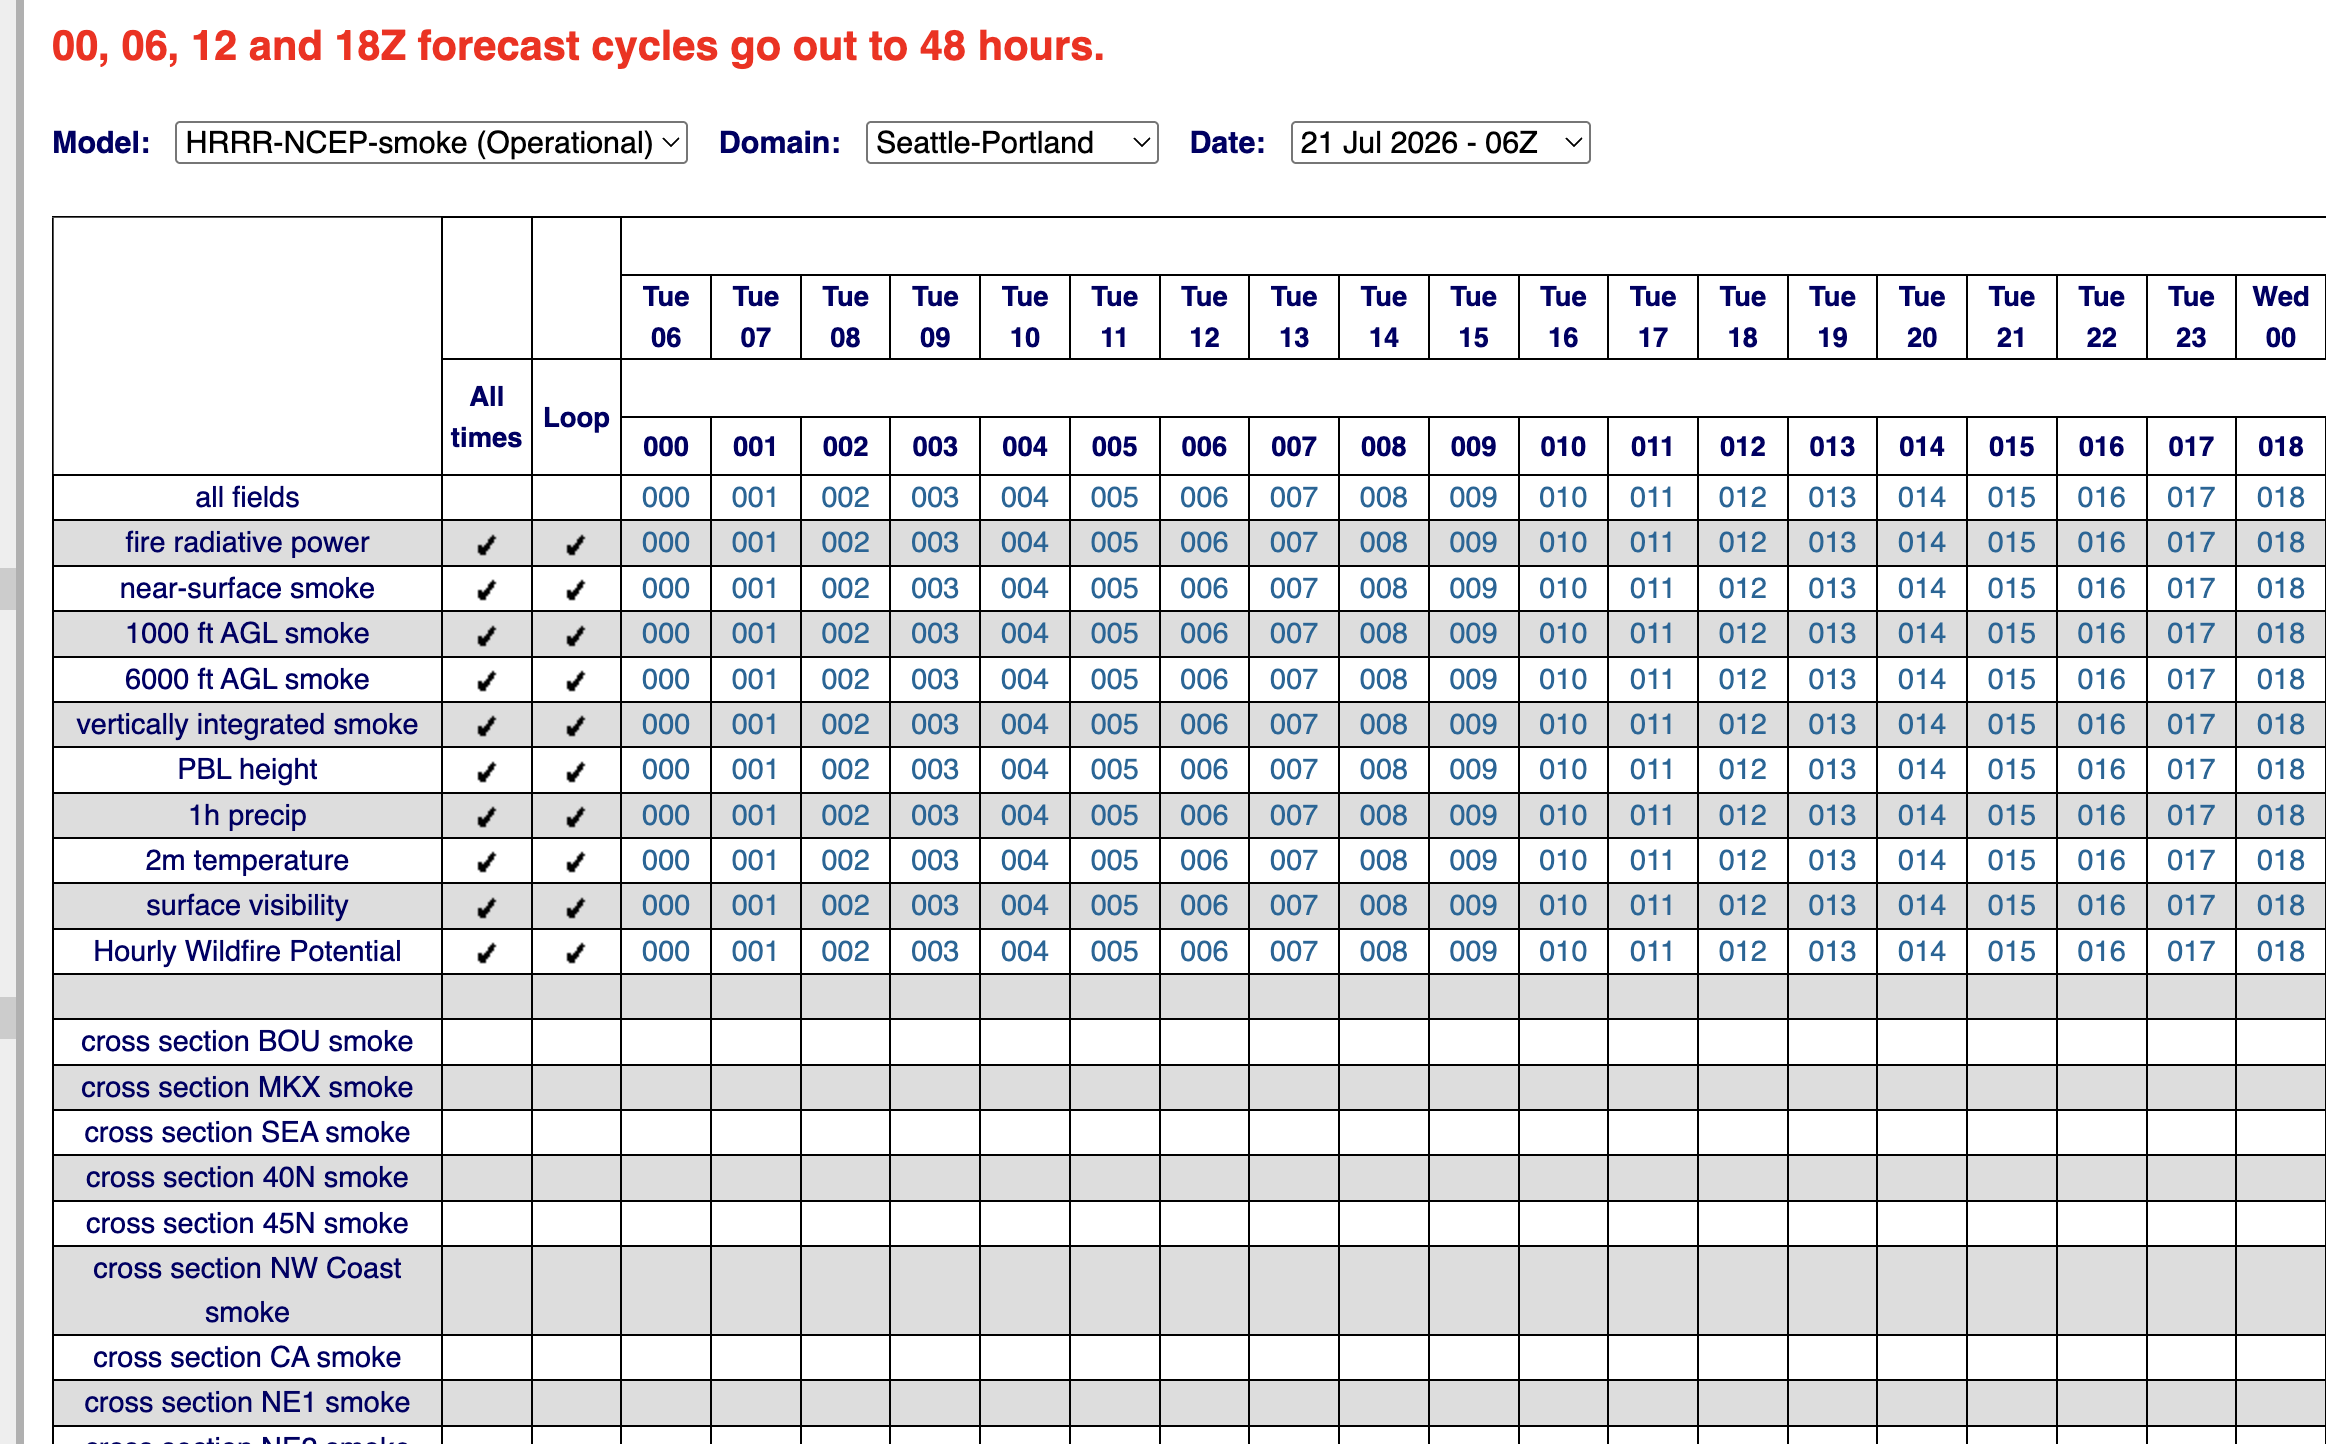
You’ll start by seeing a big grid with lots of numbers that link off to various smoke forecast products at various forecast hours.
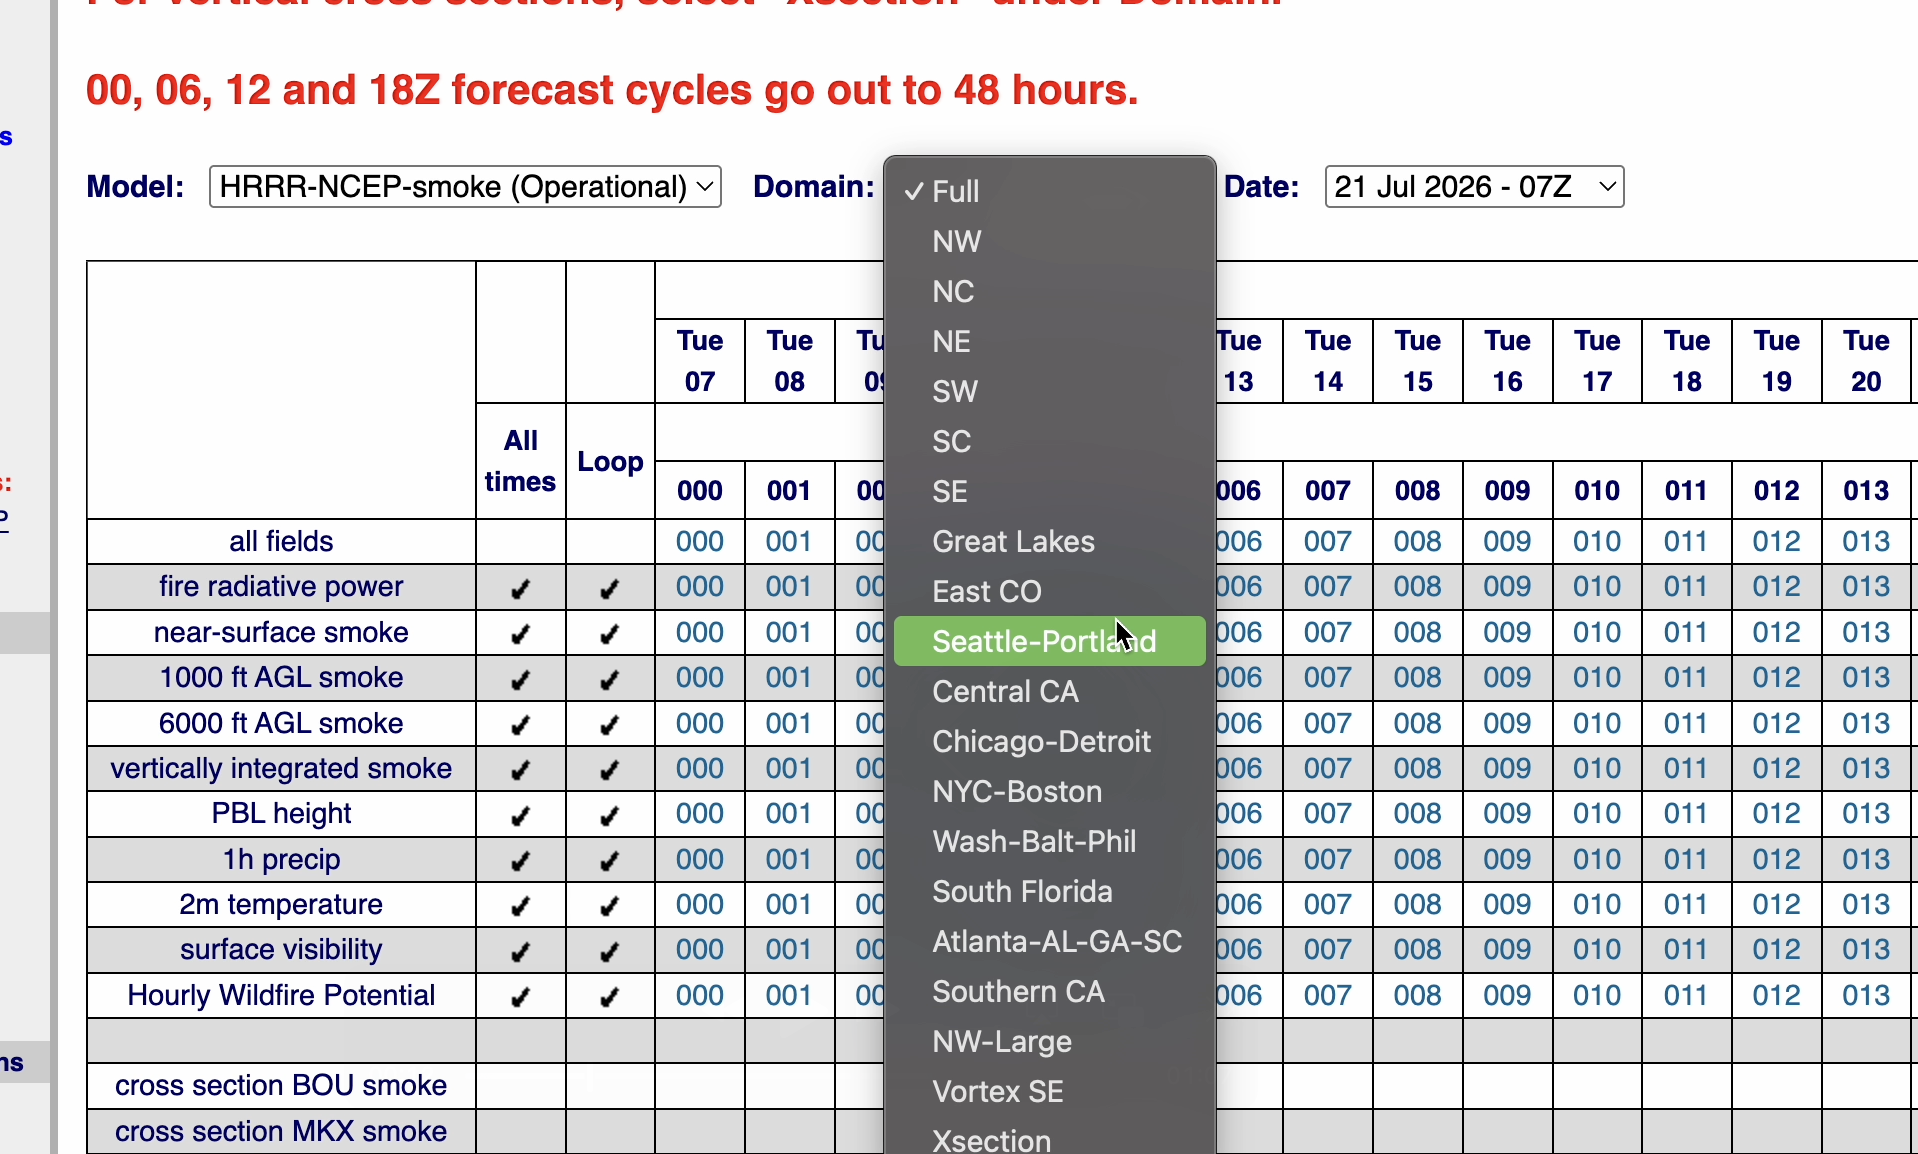
The FIRST menu box to pay attention to is the “Domain” box. This is where you can zoom the map in to your region of interest — and there are several regions across the U.S. to choose from. For here in the the Pacific Northwest, you can use “NW” for a wide look, or “Seattle-Portland” for a zoomed in map that focuses on Western Washington and Northwestern Oregon.
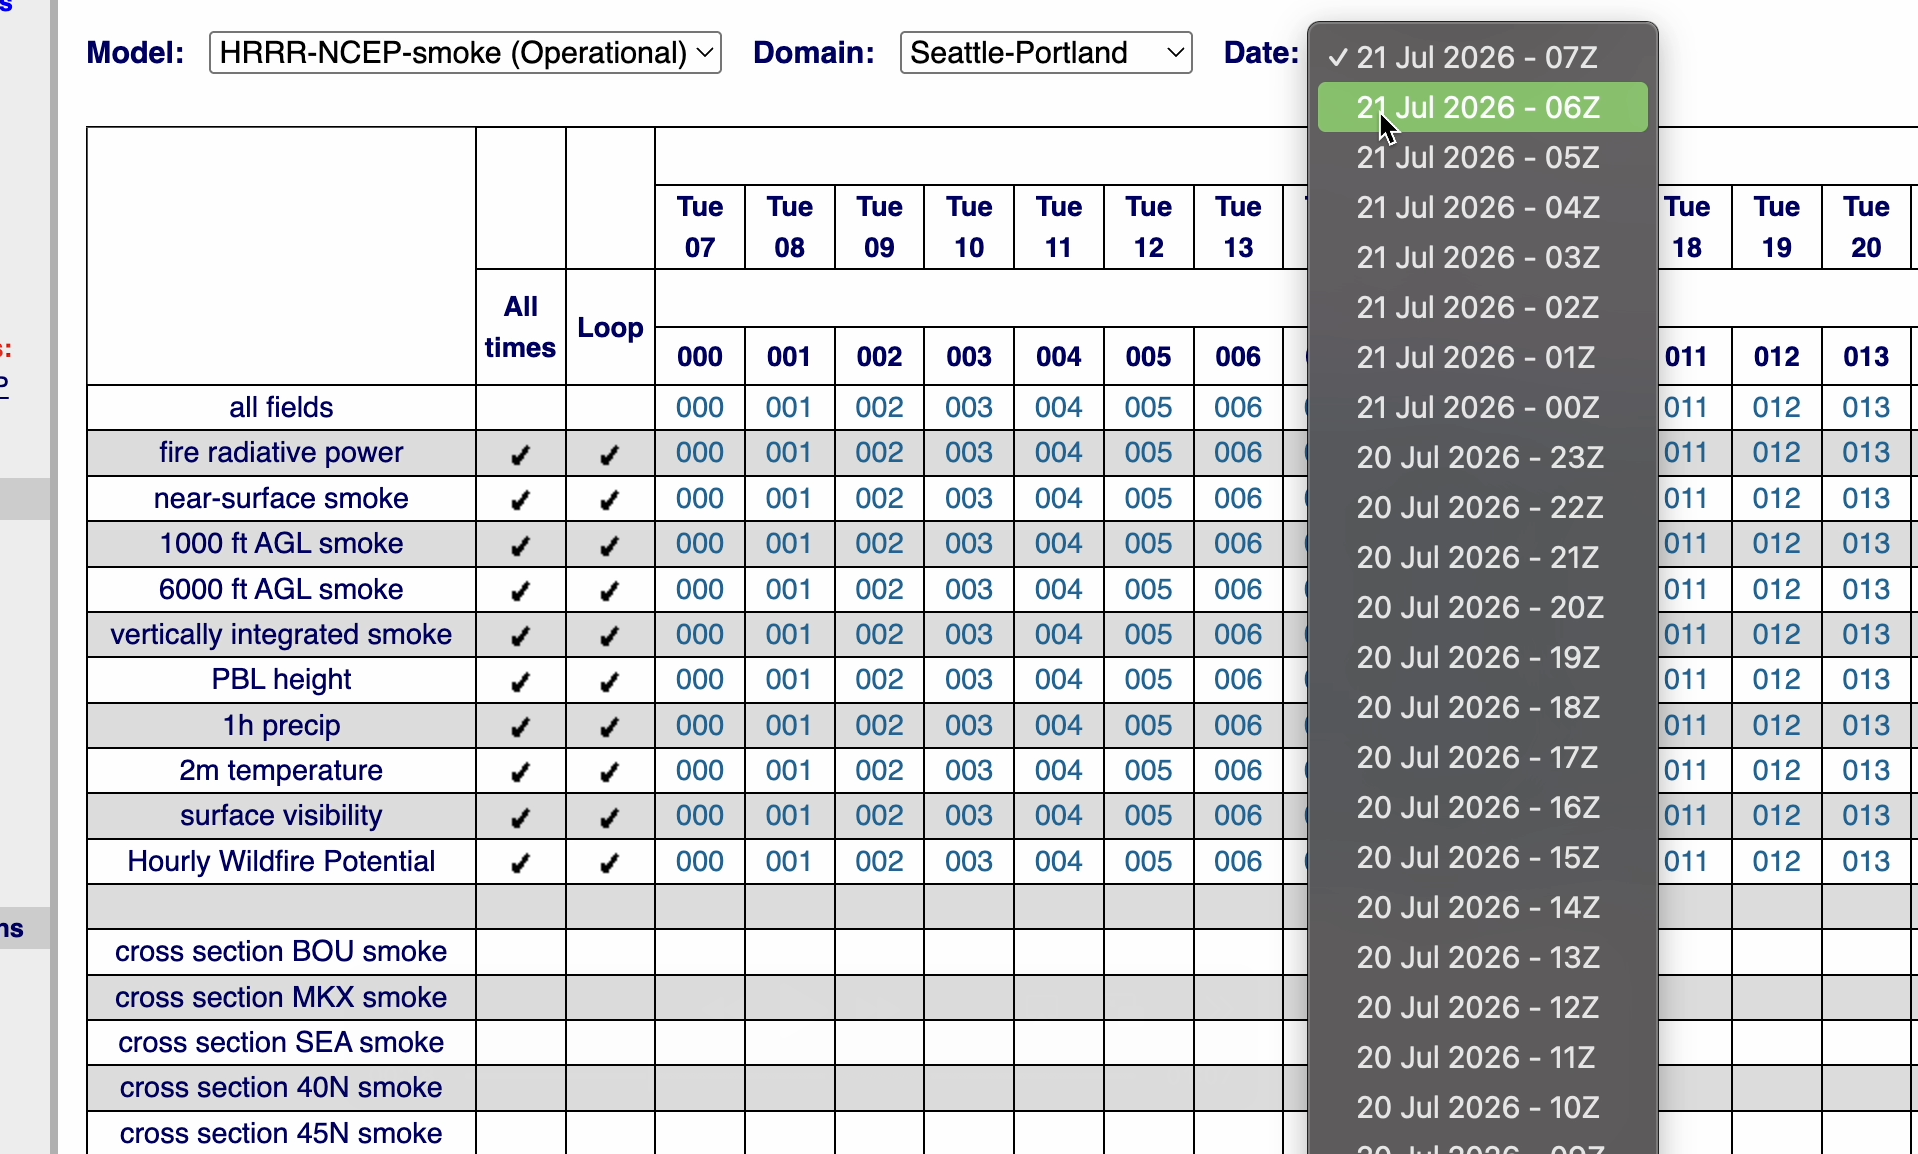
The next one to watch is “Date” and here’s where it gets a little tricky. First of all, the dates are listed in “Z” time which in the weather world is the same as the old GMT or current UTC time. For the Pacific Time Zone, Z time is +7 hours ahead during Daylight Saving Time and +8 hours when we’re back on standard time.
The model updates each hour with a new 24 hour forecast (if you only see a partial forecast, it’s because that hour’s forecast model run is still in progress.) But more importantly, the model forecasts out 48 hours every 6 hours, and only for 24 hours on the other hour’s runs. So what I do is change that drop down to the most recent hour that is divisible by 6 — be it 00Z, 06Z, 12Z or 18Z. That you will see will expand your available forecast out to 48 hours.
Once you’ve got your domain and time set, now it’s time to find your desired forecast model. There are quite a few forecast products available here, but there are two that I like to focus on: “vertically integrated smoke” and “near-surface smoke.”
The “vertically integrated smoke” is like just a general “is it going to be smoky”? forecast. The maps will show combined smoke at all levels, whether it’s aloft or along the ground.
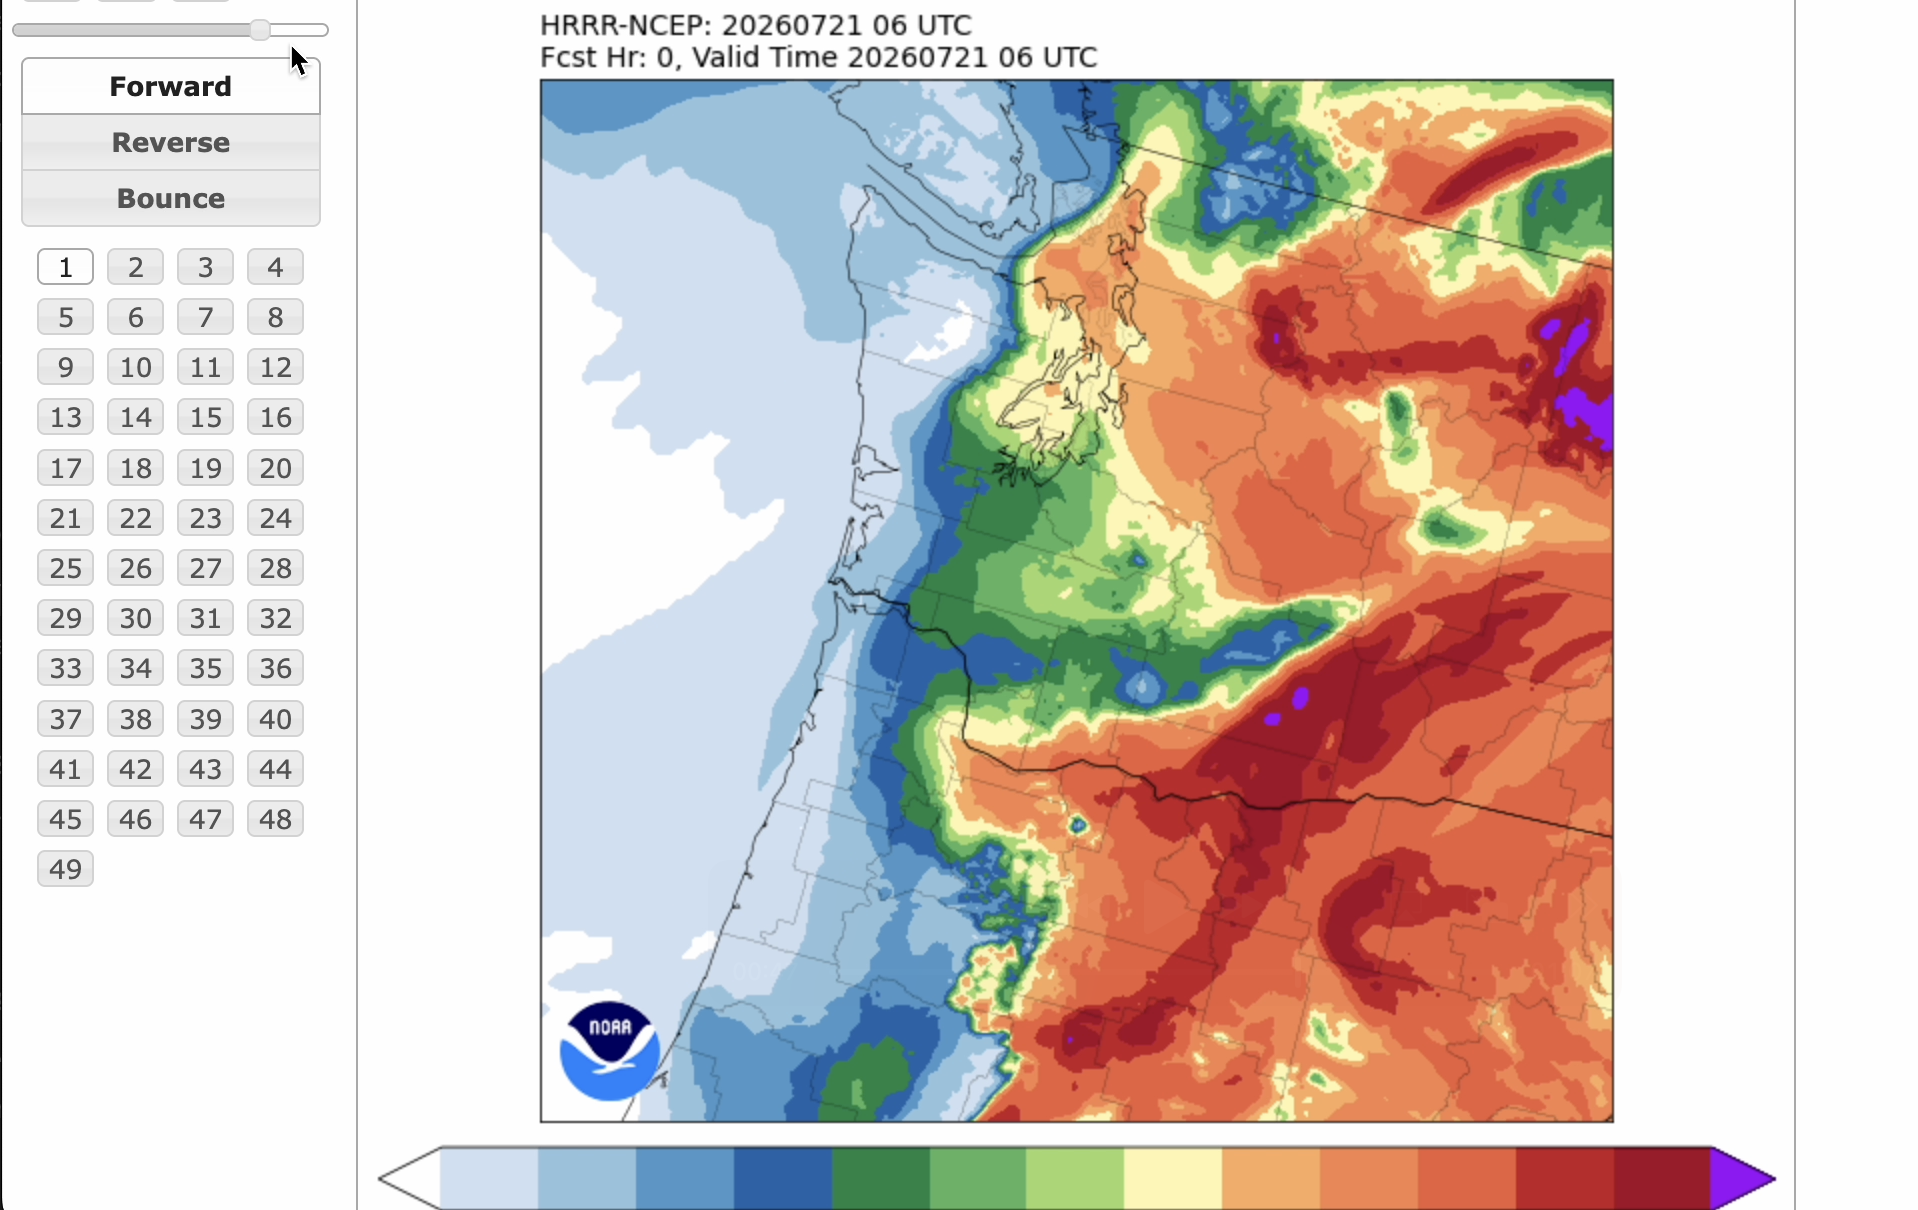
The “near-surface” smoke, as the name implies, limits the forecast output to any smoke near the ground. This is important since this would show any “breathable” smoke and where air quality may become unhealthy.
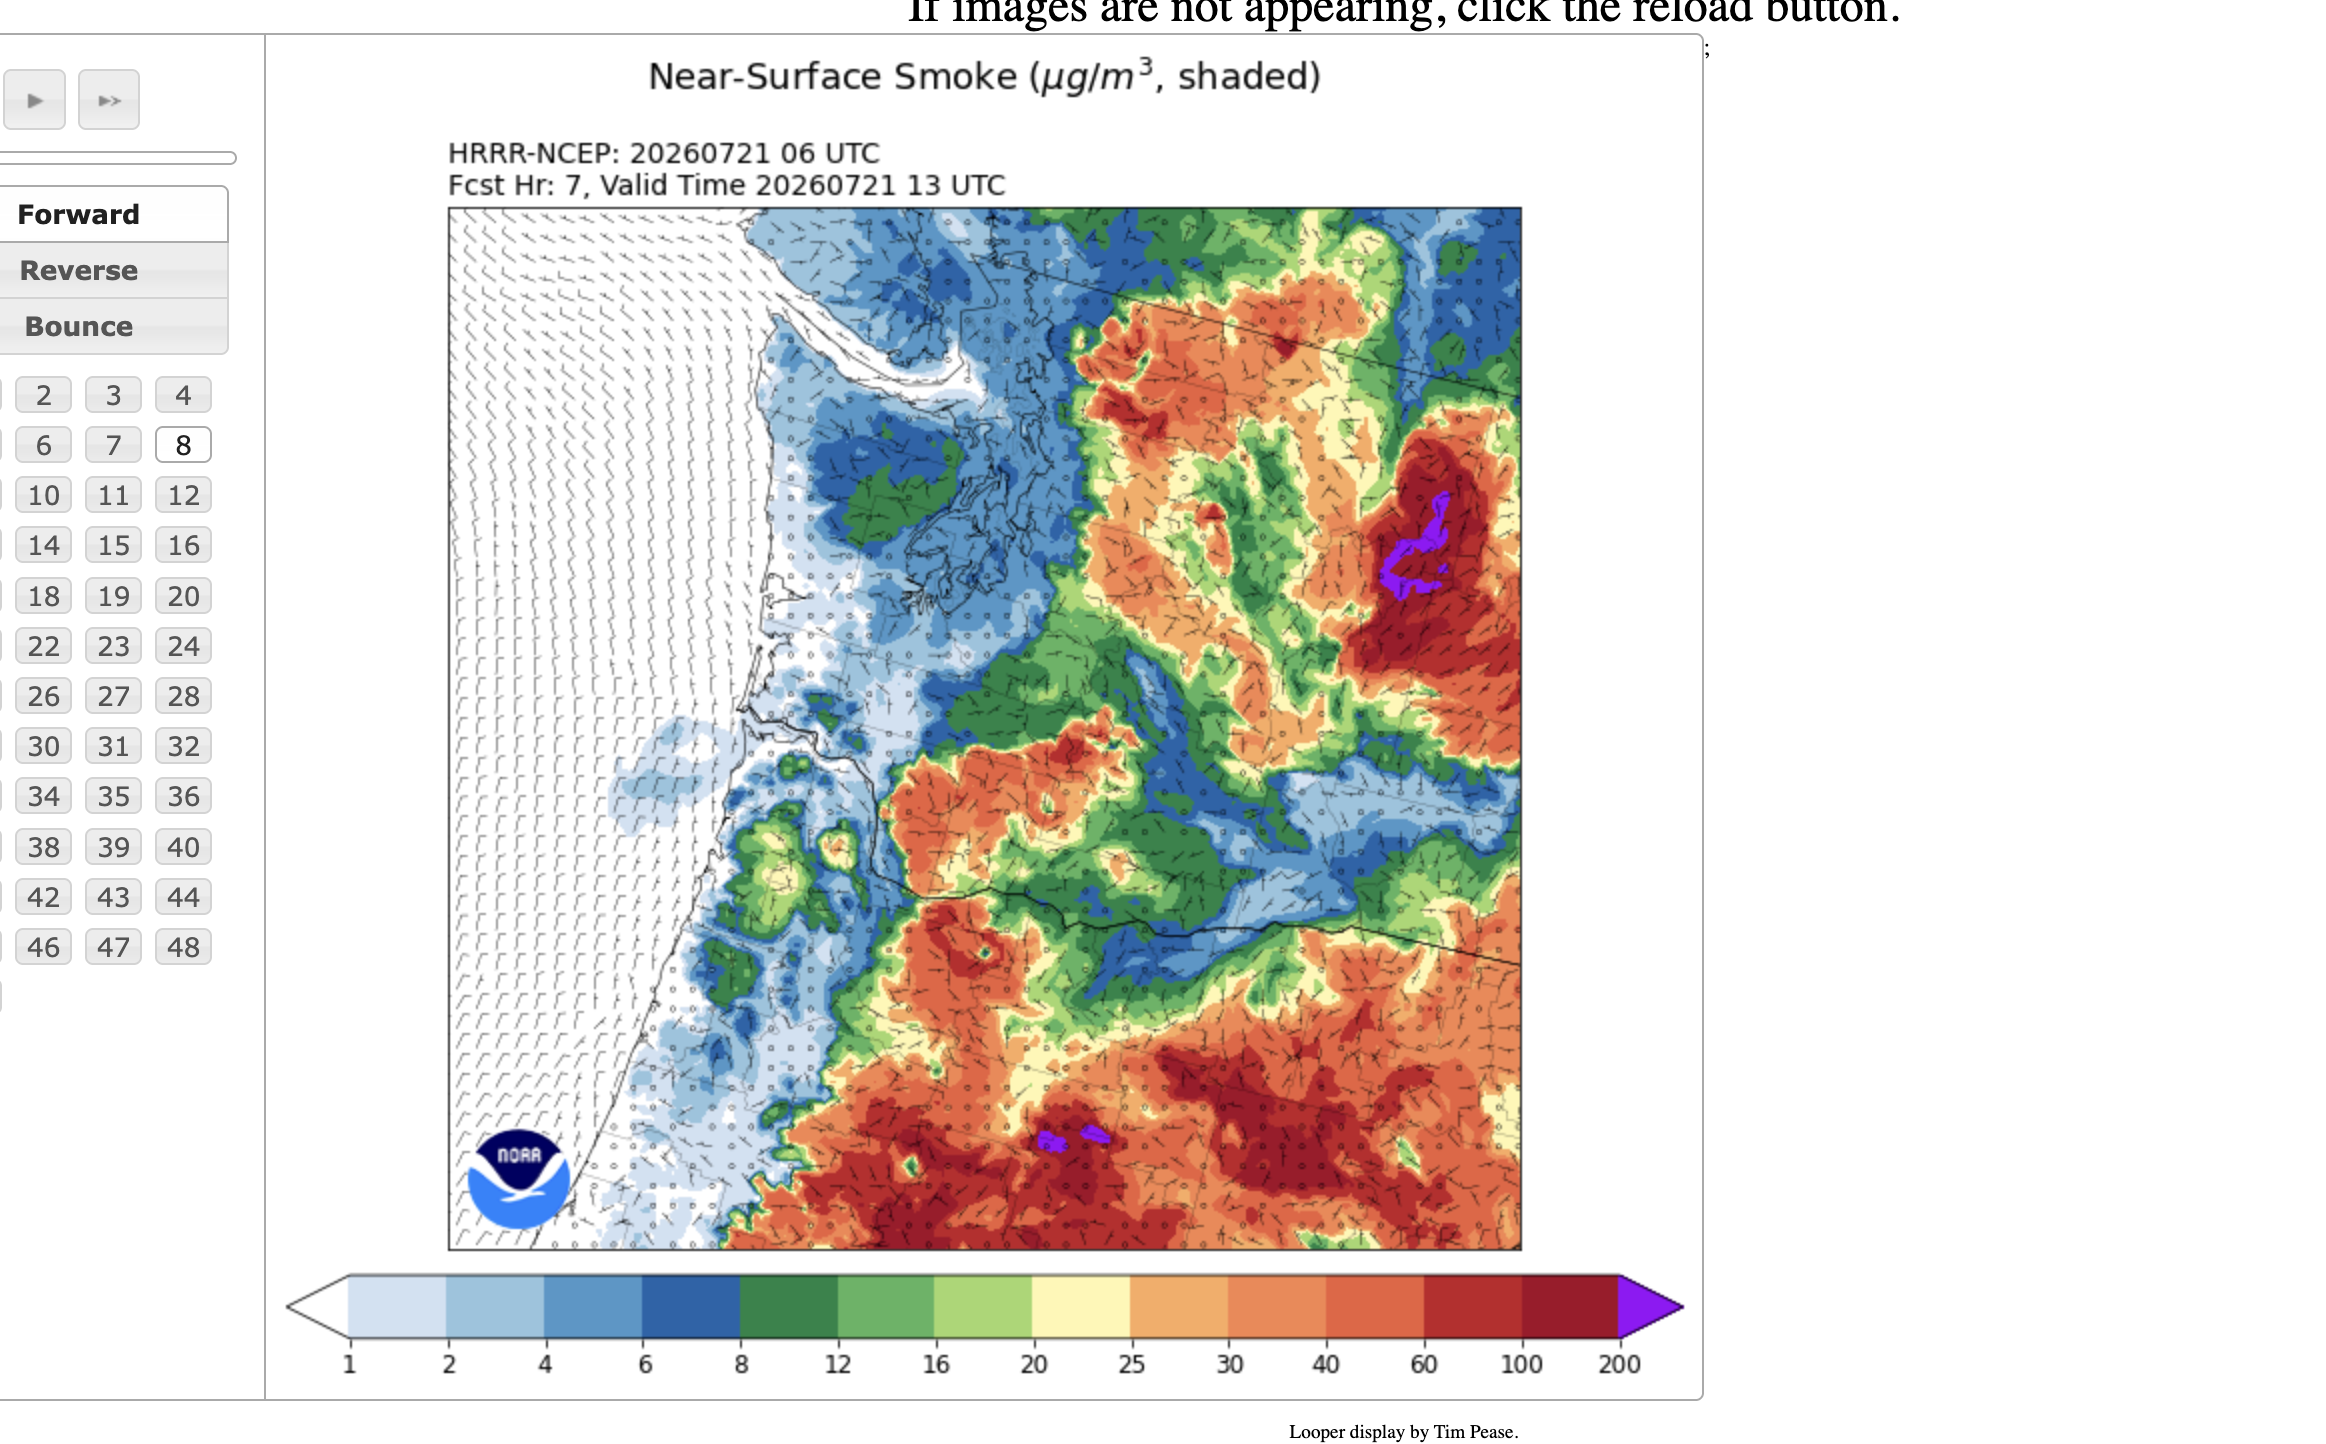
If fires are distant, many times the smoke will be aloft and make the skies hazy, but not near the ground so air quality remains OK. Closer fires or in air patterns with sinking air (like high pressure), then smoke can be pushed closer to the surface.
Next to the model title, you have choices to look at:
- “All times” — which will show every hour’s map just splashed across a page, 24-48 images deep.
- “Loop” — which will show the forecast on a looped video player
- Or you can click on individual hour forecasts.
I prefer hitting the check mark under “loop” and you’ll see why. The ensuing page gives me an animation of the next 48 hours with controls to go step by step or run it in a loop. (If the maps come up blank the first time, reload the page.)
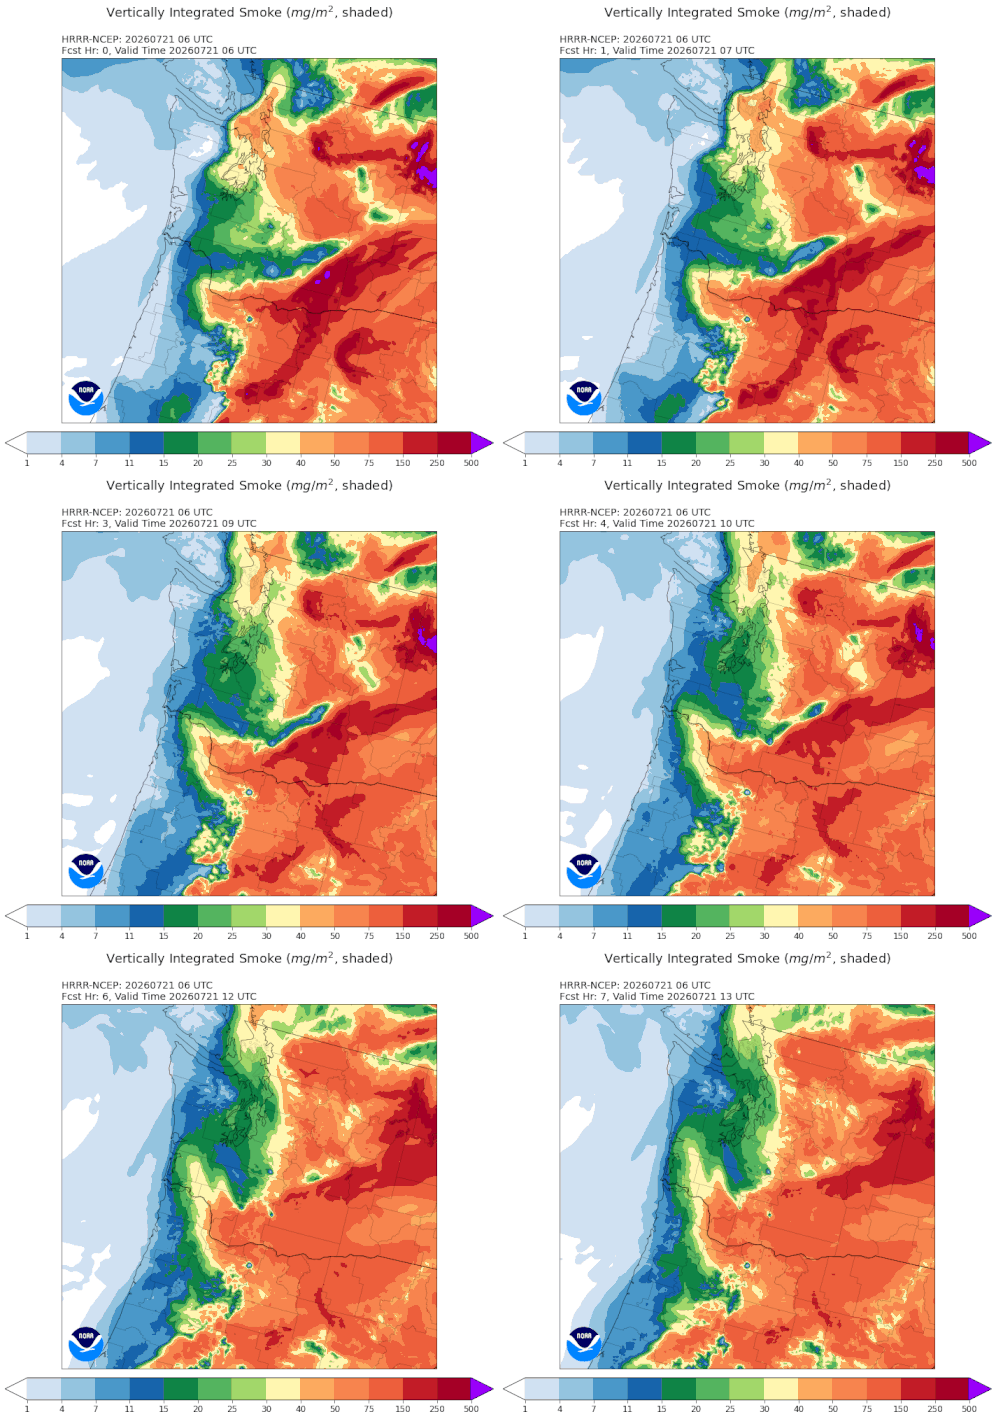
There are time stamps on each image, but again, they’re set for “Z” / UTC time so you have to do the time zone math. Remember to subtract 7 hours for Pacific Daylight Time (4 hours for EDT, 5 for CDT, etc.) So for example, a map that says it’s valid on July 23 at 03Z or 03 UTC is a forecast for 8 p.m. July 22 in Seattle.
Or, look at the smoke from the side…
Another handy visualization is if you go back to the main page and under Domain select “XSection” — this will open up a suite of forecast models that take a look at the smoke forecast “from the side”, giving a cross section of the atmosphere across certain regions.
There’s one for Seattle that will show a map like this:
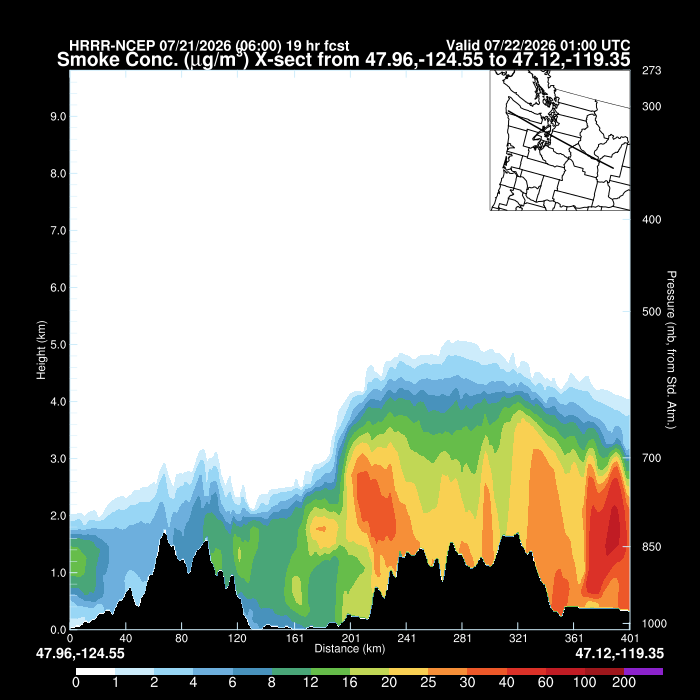
This is looking at a cross section of Western Washington from about Forks on the left to Moses Lake or so on the right. Seattle and the Puget Sound area is around the “161-201” on the distance legend at the bottom — you can see the “valley” between the Olympic Mountains on the left and the Cascades on the right.
In this example, you can see thicker smoke over the Cascades and over into Eastern Washington with some smoke aloft in the Seattle/Puget Sound area.
As the NWS notes, this HRRR-Smoke is an experimental guidance model. The agency stresses no single model run should be used as the sole basis for life-safety decisions, but it serves as an excellent tool for tracking general smoke trends.
For those interested in delving deeper into the technical mechanics, NOAA offers a comprehensive HRRR-Smoke User Guide PDF.
Any questions? Drop me a line in the comments below.